Cumulative Layout Shift is the Core Web Vital that measures visual stability: how much your page jumps around while someone is trying to read or click. It’s also the metric most likely to make a team argue with itself, because four different tools will happily give you four different numbers for the same page.
They’re not contradicting each other. They’re measuring different things. Once you know which tool answers which question, CLS becomes one of the easiest vitals to debug. This post is about the measuring part. If the metric itself is new to you, start with what CLS is. If you already know what’s shifting and want the fixes, go straight to optimizing CLS: 8 concrete fixes.
What CLS actually measures
CLS is a unitless score. Each individual layout shift is scored as the fraction of the viewport affected (impact fraction) multiplied by the distance content moved (distance fraction). Those shifts get grouped into session windows: a window opens at the first shift, extends as long as shifts keep occurring within 1 second of each other, and caps out at 5 seconds. Your page’s CLS is the score of the worst session window, not the sum of everything that happened.
The thresholds:
| Score | Rating |
|---|---|
| ≤ 0.1 | Good |
| 0.1 to 0.25 | Needs improvement |
| > 0.25 | Poor |
Two details that matter more than most people expect.
Shifts within 500 ms of a user interaction don’t count. If someone clicks “show more” and content expands, that’s expected and excluded. This is one reason lab tools disagree with real-user data in both directions.
CLS accumulates over the entire page lifetime, not just during load. Lazy-loaded images, sticky headers, infinite scroll and late-arriving ad slots all count. Lab tools that load the page and stop will miss every one of them.
First, understand field vs lab
This distinction explains nearly every “but the tool said it was fine” conversation.
Field data comes from the Chrome User Experience Report (CrUX): anonymized measurements from real Chrome users, aggregated at the 75th percentile over a rolling 28-day window. This is what Google uses for page experience signals. It’s real, it’s slow to move, and it’s what you’re ultimately graded on.
Lab data comes from a synthetic test: a single simulated page load on an emulated mid-tier device with a throttled network. It’s instant and reproducible, which makes it good for debugging. It’s also a fiction. One visitor, one load, no scrolling, no interaction.
Field data tells you whether you have a problem. Lab data tells you why. You need both.
1. Google Search Console: your site-wide scoreboard
Where: Search Console, then Experience, then Core Web Vitals, with a Mobile and a Desktop report.
This is pure CrUX field data, and it’s the report to open first because it’s the only one that shows you the whole property at once.
Data is grouped into URL groups, clusters of similar pages that usually correspond to templates. Product pages, blog posts and category listings tend to form their own groups. A group’s status is set by its worst-performing metric, so great LCP and INP won’t save a group with poor CLS. The group figure is the 75th percentile: 75% of visits to pages in that group had a CLS at or below that number. Click into an issue to see example URLs, then click a URL to see other members of its group and jump straight to a PageSpeed Insights test.
What to do with it: identify the failing template, not the failing page. If a shared header, cookie banner or third-party ad slot is the culprit, one fix will move hundreds of URLs at once. Chasing individual URLs here is almost always wasted effort.
Some limits to keep in mind. Only indexed URLs appear, and only groups with enough traffic to hit CrUX’s reporting threshold, so low-traffic sites may see very little or nothing at all. The examples table caps at 200 rows. And the 28-day rolling window means a fix you shipped last week will take weeks to fully show up. Don’t panic-revert because the graph hasn’t moved yet.
2. PageSpeed Insights: field and lab for a single URL
Where: pagespeed.web.dev
PSI is the bridge between the two data types, and the comparison between its two halves is the most useful diagnostic signal it gives you.
The top section (“Discover what your real users are experiencing”) is CrUX field data for that specific URL. If the URL doesn’t have enough traffic on its own, PSI falls back to origin-level data. Check which one you’re looking at; people misread origin-level data as page-level data constantly.
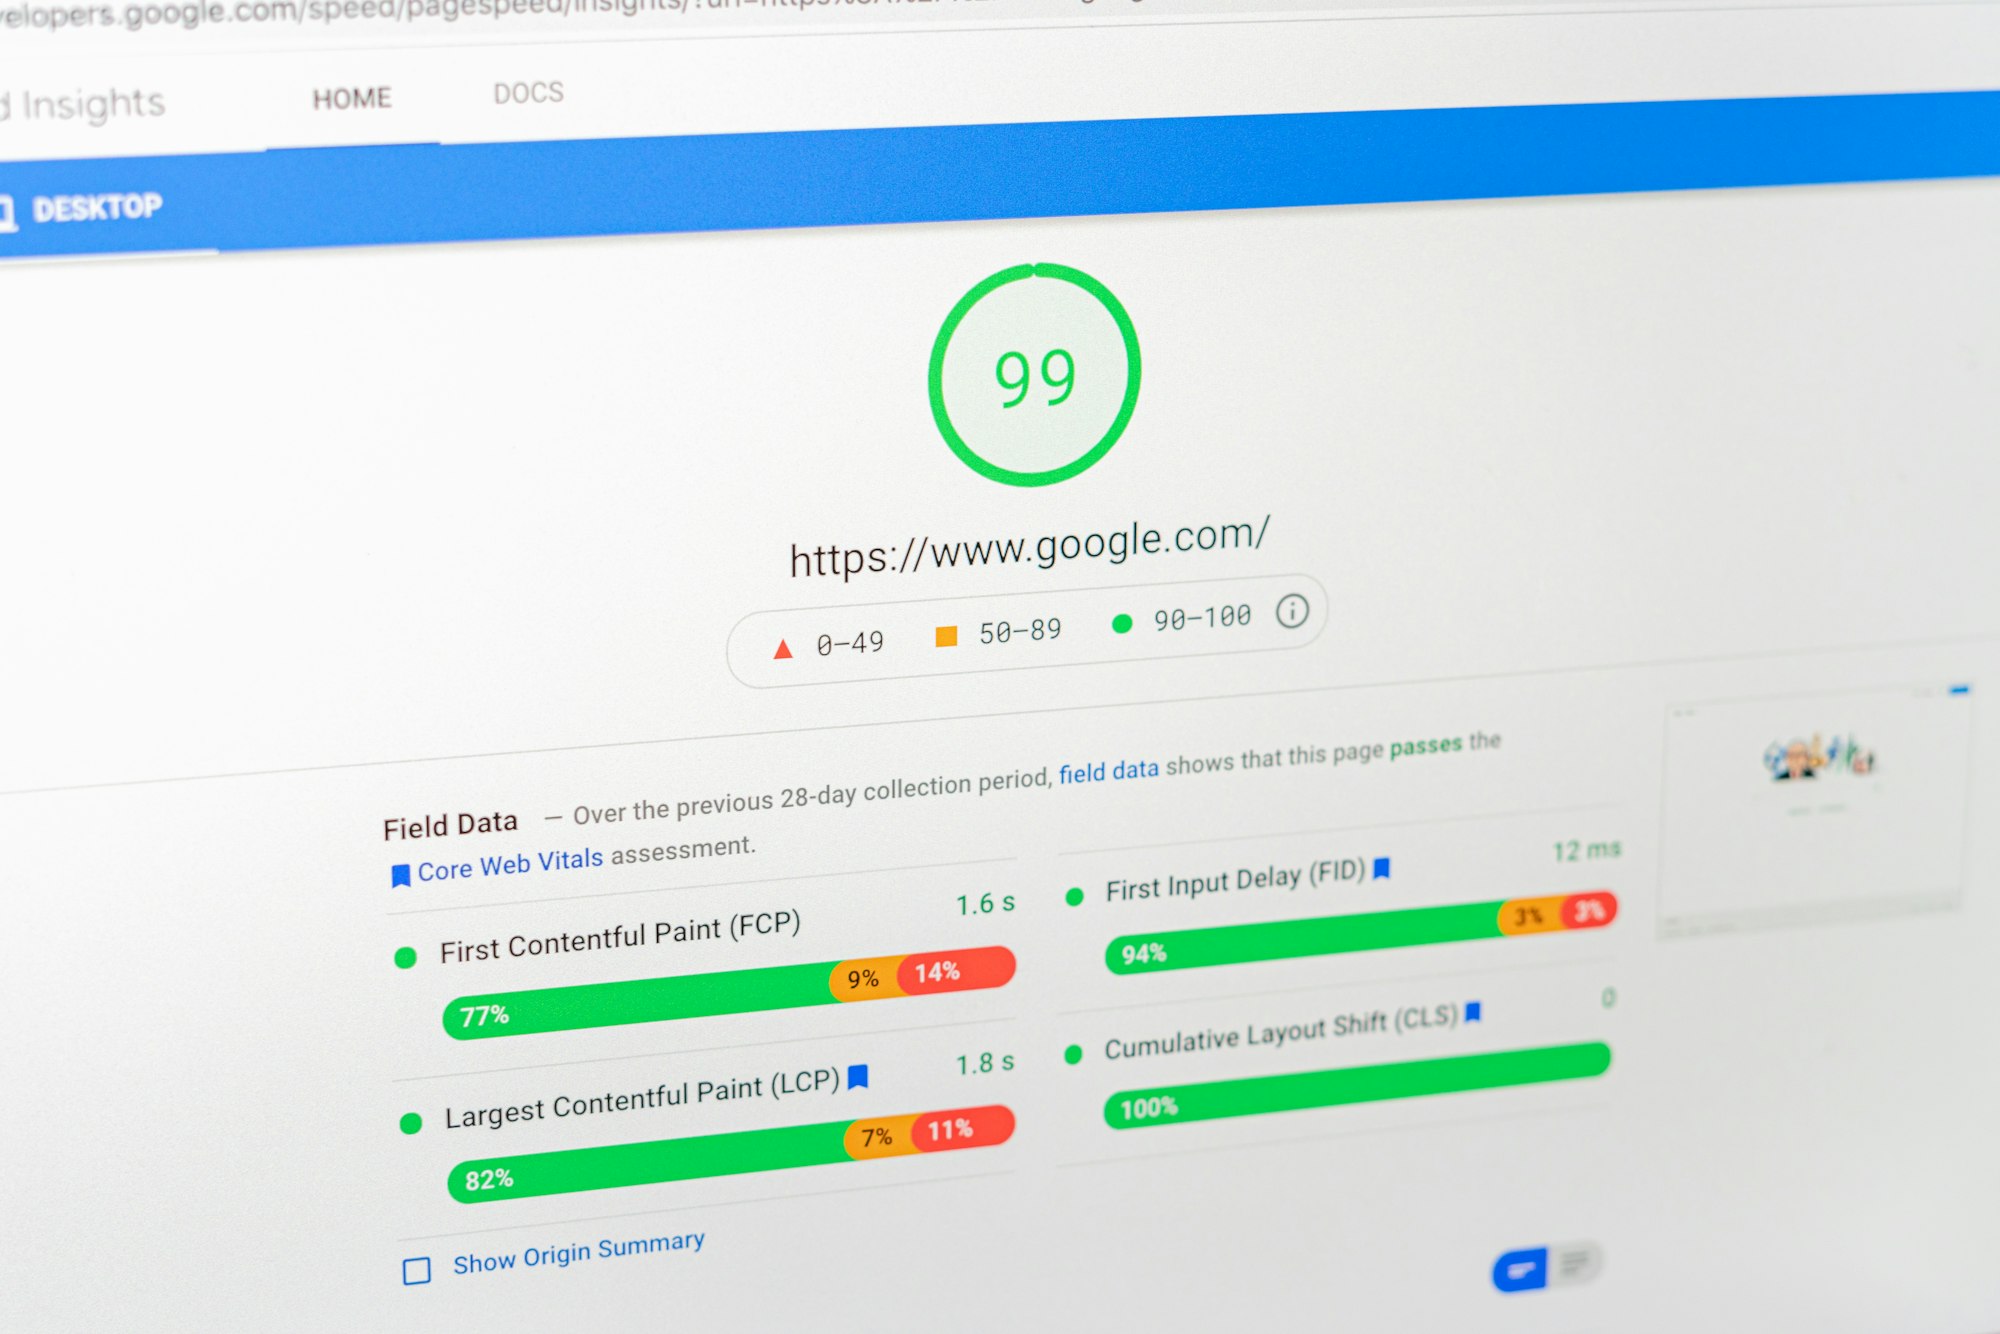
The bottom section (“Diagnose performance issues”) is a Lighthouse lab run. CLS sits among the five metrics at the top, and under Lighthouse 12+ it accounts for a quarter of the overall Performance score.
The diagnostic to open is Layout Shift Culprits, in the Insights section of the report. It lists the elements that shifted, how much each contributed to CLS, and, where Lighthouse can work it out, a probable root cause labelled something like “unsized image”, “font request” or “injected iframe”. Recent Lighthouse versions folded the old separate audits (layout shifts, unsized images, non-composited animations) into this single insight.
One caveat: Lighthouse identifies the elements that moved, which are usually the victims rather than the cause. If a banner injects itself at the top of the page, the audit will list everything below it. Read the list as a pointer to a region of the page, then find what got inserted above it.
Now read the two numbers together. If field CLS and lab CLS are both bad, you have a load-time shift, and Layout Shift Culprits will usually name it. If field CLS is bad and lab CLS is 0.00, you have a post-load shift: Lighthouse never scrolled and never waited for the third lazy-loaded ad. Skip to DevTools.
That second case is by far the most common CLS question I get asked. “We score 100 in PageSpeed but fail Core Web Vitals” sounds like a contradiction. It isn’t. It’s just two tools answering two different questions.
3. Chrome DevTools: where you actually fix it
DevTools is no longer just a lab tool for CLS. Two features matter here.
Live metrics (Performance panel landing page)
Open DevTools and go to the Performance panel. Before you record anything, the panel shows live local LCP and CLS for the current page, updating in real time as you scroll and interact. Under the metric cards, the Layout shifts table logs every shift with its score and the elements involved. Hovering an entry highlights it in the viewport, clicking selects it in the Elements panel.
This is the tool for reproducing post-load CLS. Load the page, then behave like a user: scroll to the bottom, hover the nav, open the mobile menu, dismiss the cookie banner, resize. Watch which action makes the number climb.
You can also enable field data in the panel to pull CrUX numbers for the current URL alongside your local ones, switch between origin and URL data, and toggle mobile vs desktop. It’s a fast way to see whether what you’re reproducing locally matches what users experience.
Recording a trace
Once you can reliably reproduce a shift, record a trace. The results include a dedicated Layout Shifts track, with clusters shown as bars and individual shifts as markers. Clicking one gives you a before/after animation of the shift, the affected elements, the shift’s score and which session window it belongs to. So you can see exactly which cluster is setting your CLS, and stop optimizing the ones that aren’t.
Two supporting tricks. In the Rendering drawer, turn on Layout Shift Regions: it paints a blue flash over any area that shifts, and it’s the fastest way to spot shifts you’d otherwise miss. And throttle to Slow 4G with a mid-tier CPU. Layout shifts are a race condition between resources arriving. On a fast connection everything arrives at once and nothing shifts. Your users aren’t on your office wifi.
4. The Web Vitals extension: what happened to it
Google’s official Web Vitals Chrome extension is retired. Support ended on 7 January 2025, when the Chrome team merged its functionality into the DevTools Performance panel. The live metrics view described above is its direct replacement. The extension may still be installed on your machine and may still appear to work, but it’s unmaintained and no longer receives updates.
If you were using it for the ambient badge and the quick CLS readout, you have three options now.
DevTools live metrics is the official successor and strictly more capable.
Several community-maintained extensions offer an on-page overlay of CWV metrics without needing DevTools open. Useful for scanning many pages quickly, but verify anything they report against DevTools before acting on it.
The web-vitals JavaScript library is the real answer for ongoing measurement. It’s the same library the extension was built on, it attributes shifts to specific elements, and you can send the data to your analytics platform. This gives you your own field data, at your own URL granularity, updated in hours rather than 28 days.
If you’re doing CLS work more than occasionally, setting up web-vitals RUM is the highest-leverage thing on this list. Every other tool in this post is a sample of a problem you could be measuring directly.
A workflow that works
- Search Console: find which templates are failing, mobile and desktop separately.
- PageSpeed Insights on a representative URL: compare field CLS against lab CLS to work out whether the problem is at load or after it.
- DevTools: reproduce it. Live metrics plus Layout Shift Regions for post-load shifts, a trace with the Layout Shifts track for load shifts.
- Fix it: width and height attributes or
aspect-ratioon all media, reserved space for ads and embeds,font-display: optionalor matched fallback metrics for web fonts, banners overlaid rather than inserted, andtransforminstead of layout-triggering properties for animations. The details and ready-to-paste snippets are in the CLS fixes article. - Verify in the lab immediately, in the field patiently. DevTools confirms the fix in seconds. CrUX will take a few weeks to catch up, and Search Console a little longer still.
Why your numbers disagree: a cheat sheet
| Symptom | Likely explanation |
|---|---|
| PSI lab CLS is 0, field CLS is poor | Post-load shifts: lazy loading, ads, scroll-triggered content |
| DevTools local CLS much lower than field | Your device and connection are too fast; throttle |
| Search Console group differs from PSI for a URL | The group aggregates similar pages; that URL may be an outlier |
| CLS varies wildly between identical test runs | Race condition: some resource sometimes wins, sometimes loses |
| Fixed weeks ago, Search Console still red | 28-day rolling window plus reporting lag |
| Mobile fails, desktop passes | Narrower viewport, so the same pixel shift covers more of it |
CLS is a lagging indicator built from real sessions you can’t see. Most of the work is reproducing, on your own machine and on purpose, the conditions your users hit by accident. The tools above are how you do that; the fixes are what you do next.